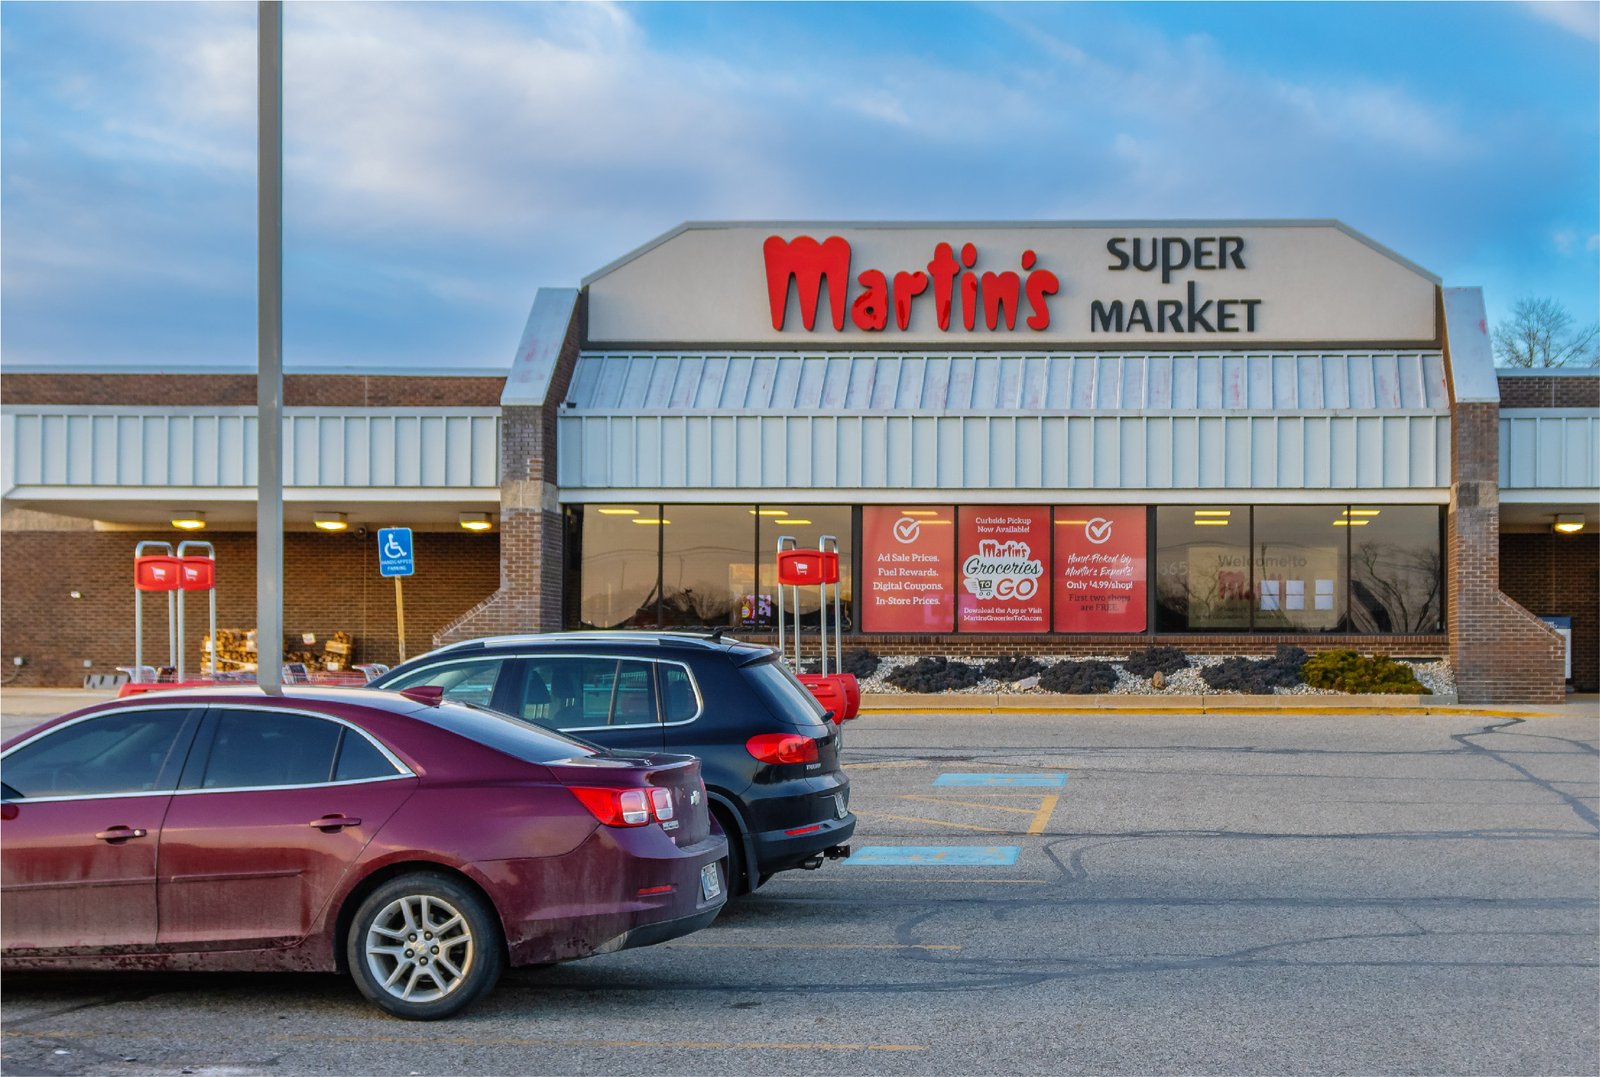
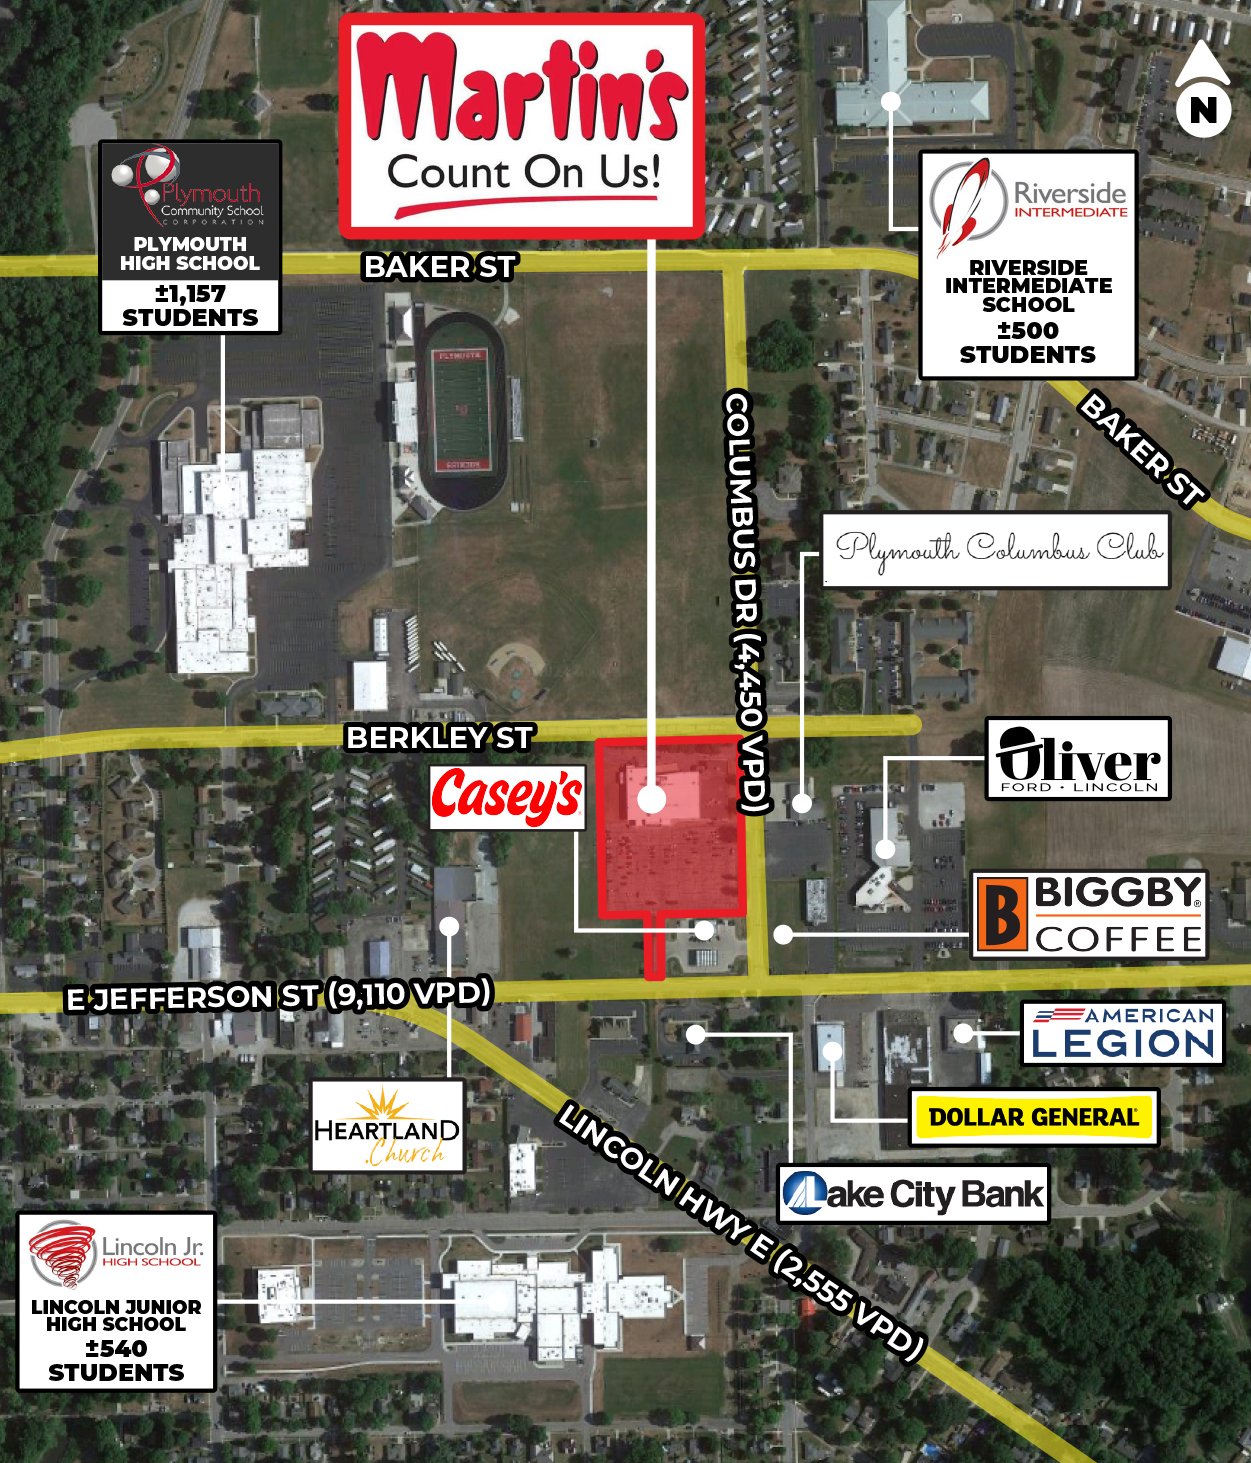
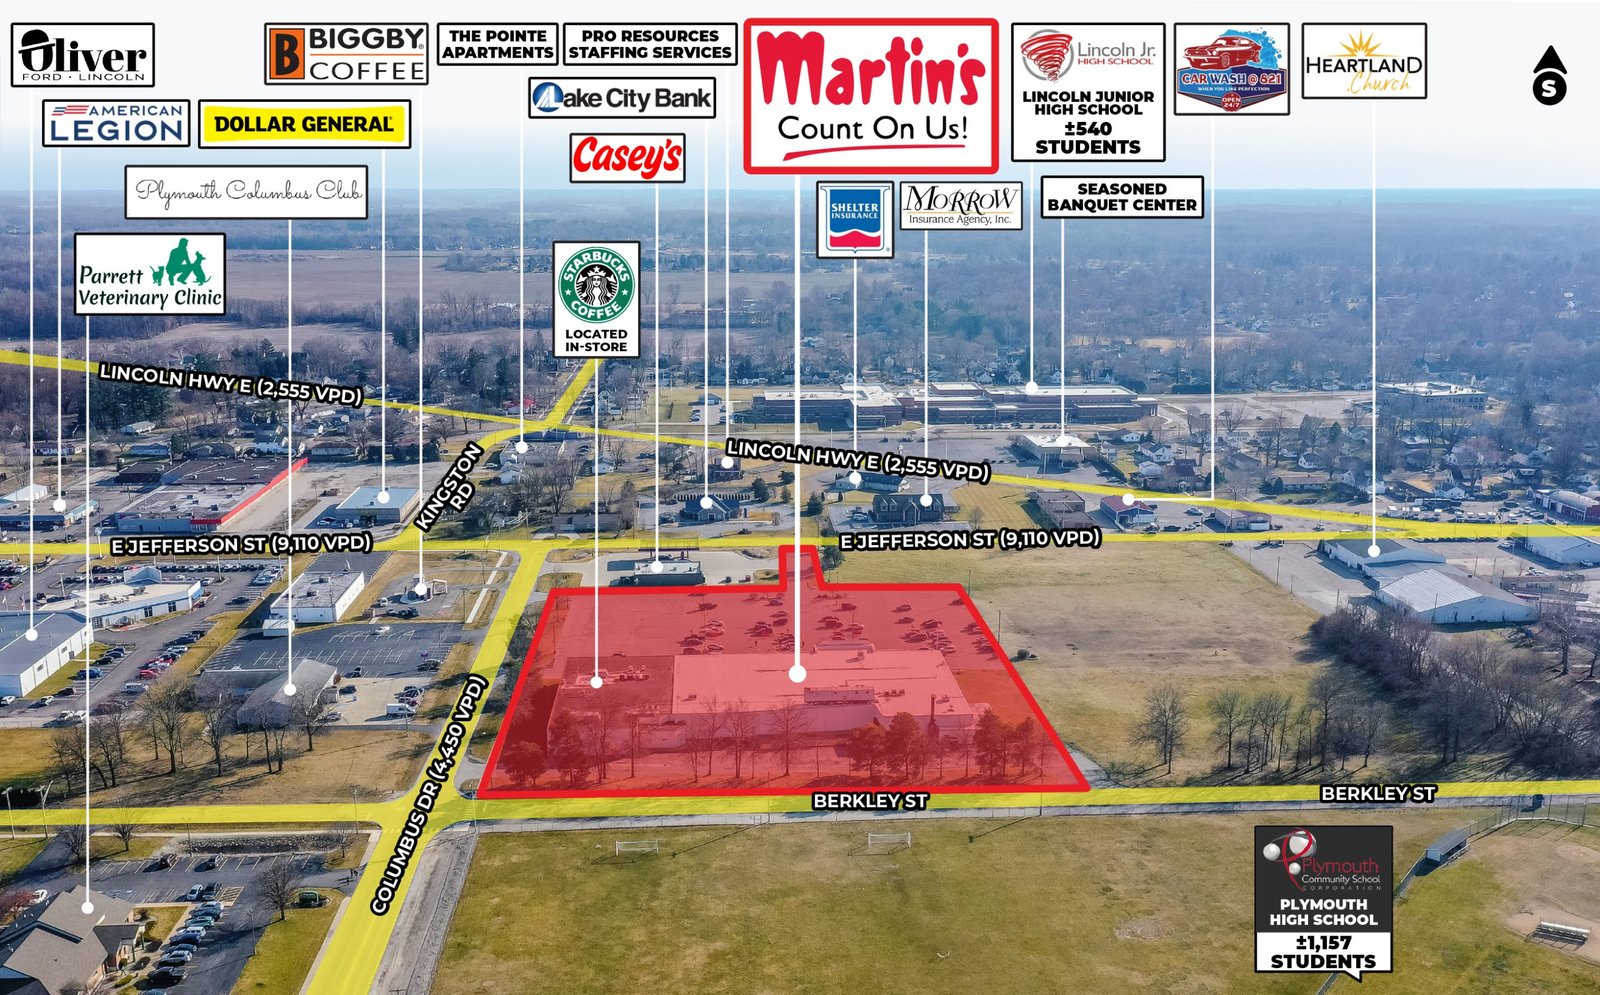
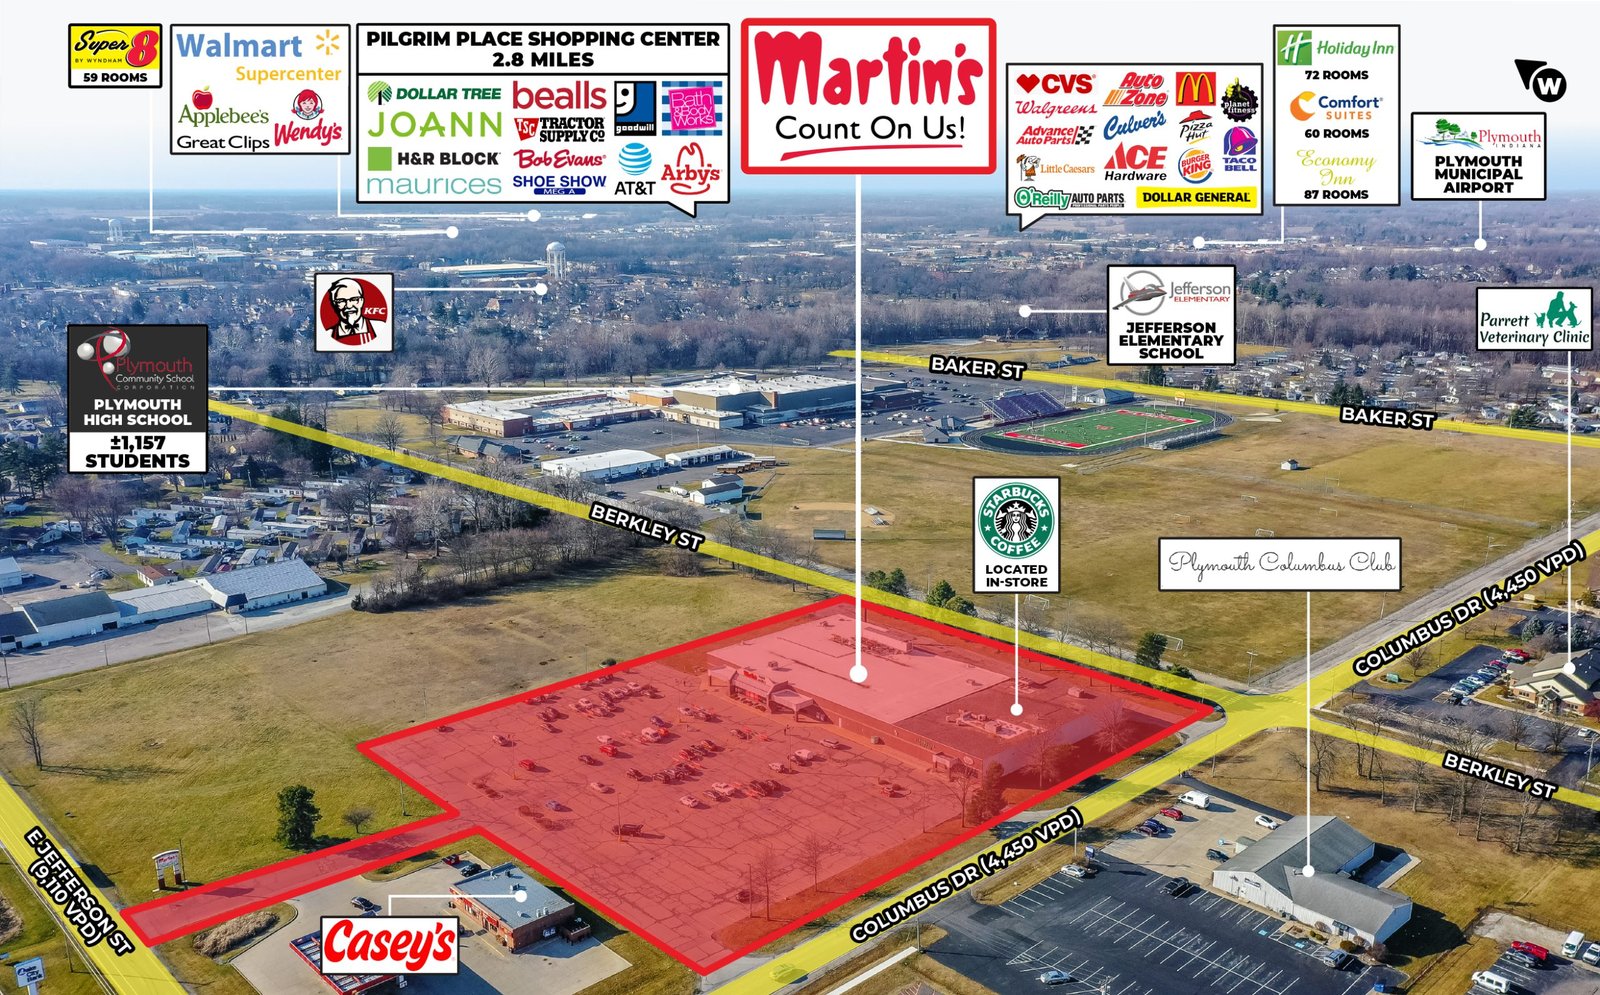
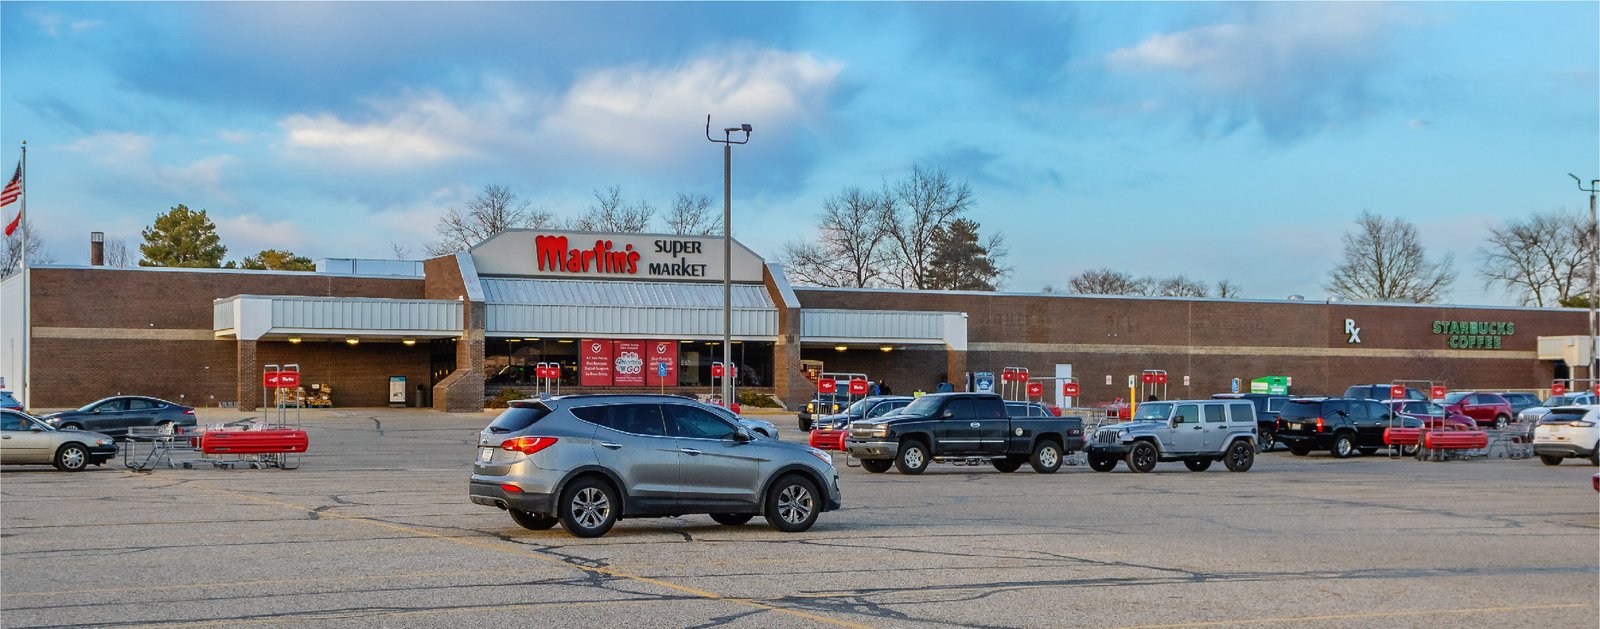
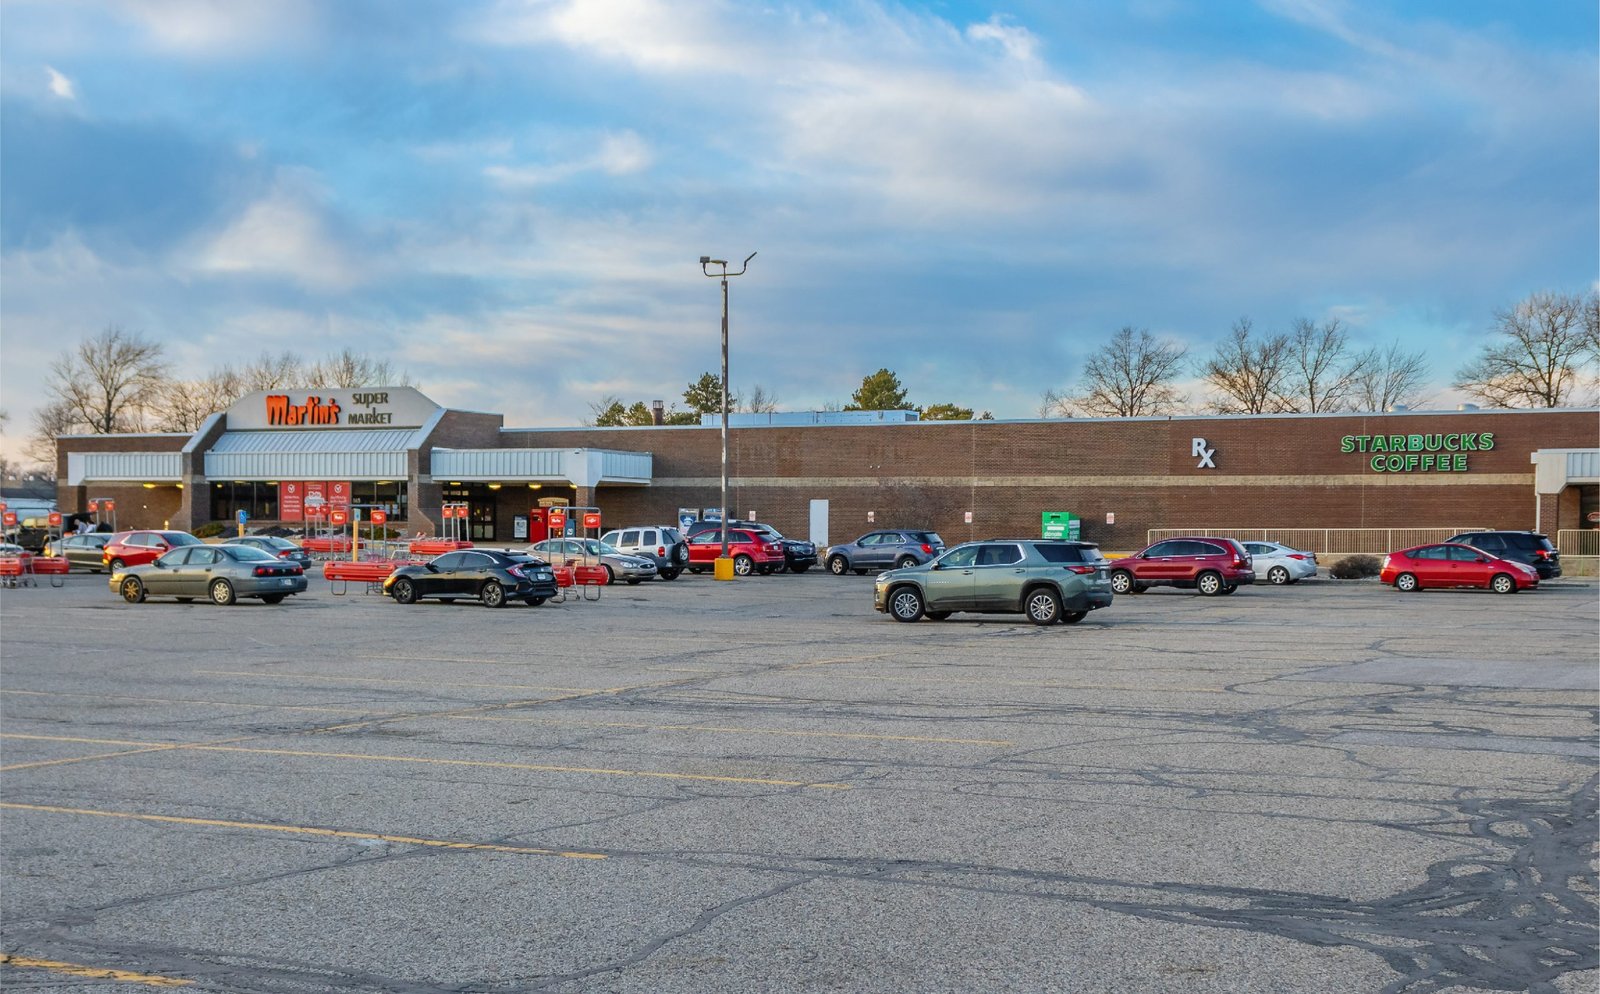
This Martin’s Super Market NNN investment represents premium Retail Commercial Real Estate in Plymouth, Indiana. The property features a corporate guarantee from SpartanNash Company. The tenant shows a twenty-four-year operating history at this specific location. This asset provides a passive income stream with recent capital improvements including a new roof installed in 2021.
Investment Highlights
- Asset Type: Single-Tenant Grocery.
- Lease Structure: NNN Corporate Guaranteed.
- Remaining Term: ±8 Years.
- Renewal Options: Two 5-Year Options (Automatic Renewals).
- Operating History: 24+ Years at this site.
- Guarantor: SpartanNash Company (NASDAQ: SPTN).
- Recent Upgrades: New roof installed in 2021 with a transferable warranty.
Market Analysis: The Plymouth Retail Market
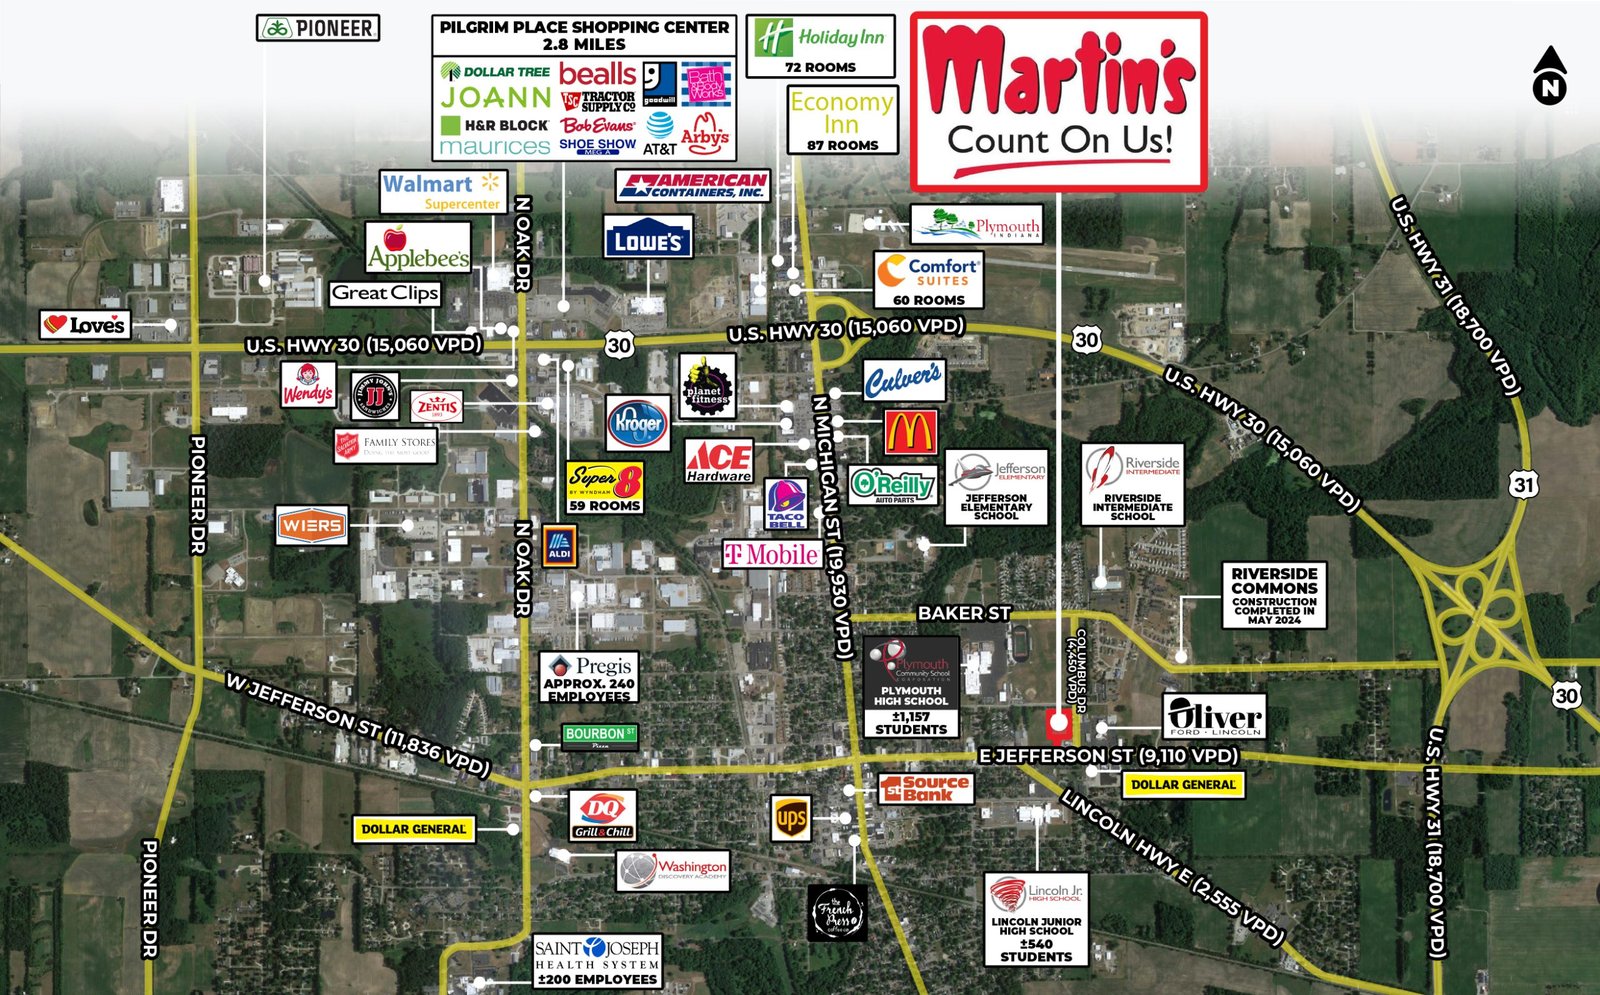
Plymouth serves as a regional economic hub in Northern Indiana. The area supports steady residential density and strong workforce fundamentals. Grocery assets perform exceptionally well in this market. The location captures daily trips from the surrounding population. Residual value remains secure due to the essential nature of the grocery sector. Investors reviewing Illinois Commercial Real Estate often expand into nearby Indiana markets for higher yield opportunities.
Tenant Profile: SpartanNash & Martin’s Super Market
Martin’s Super Market operates as a regional retail powerhouse. The lease features a corporate guarantee from SpartanNash Company. SpartanNash ranks as a leading food distributor and grocery retailer. The company trades publicly on the NASDAQ. This tenant profile provides maximum security for the asset. Grocery locations lead the market in the Grocery Anchored Shopping Centers sector due to their daily-needs consumer base. Financial stability remains high even when economic trends shape commercial real estate negatively in other regions.
Acquisition Strategy
This property fits perfectly into a defensive portfolio. The NNN lease structure limits landlord obligations strictly to the roof and structure. The new roof mitigates near-term capital expenditure risk. Buyers evaluating a 1031 Exchange in Commercial Real Estate find grocery assets highly desirable for their long-term stability. For groups analyzing Acquiring Commercial Real Estate Financing, this corporate-backed lease offers highly favorable underwriting conditions. The asset provides a clear understanding of Cap Rate vs Yield Explained through consistent returns.
View Available Properties for more data on high‑performing regional markets.